How to Read Financial Statements: A Beginner’s Guide

Investing in a company can be either a thrilling or overwhelming idea. It can be challenging for a professional investor as well; they might get nervous about the possibility of coming across an opportunity while also being afraid of making a wrong investment decision and losing money.
But what if we tell you that you can now get the right directions on how to navigate numbers easily with this beginner finance guide?
There is where a financial statement analysis, which examines the income and balance sheets, is functional, especially when it comes to using metrics such as revenue growth, EPS, profit margin, and return on equity. They assist us in assessing the company’s viability and deciding whether or not it merits investment.
10 Warning Signs in Financial Statements Every Investor Must Know

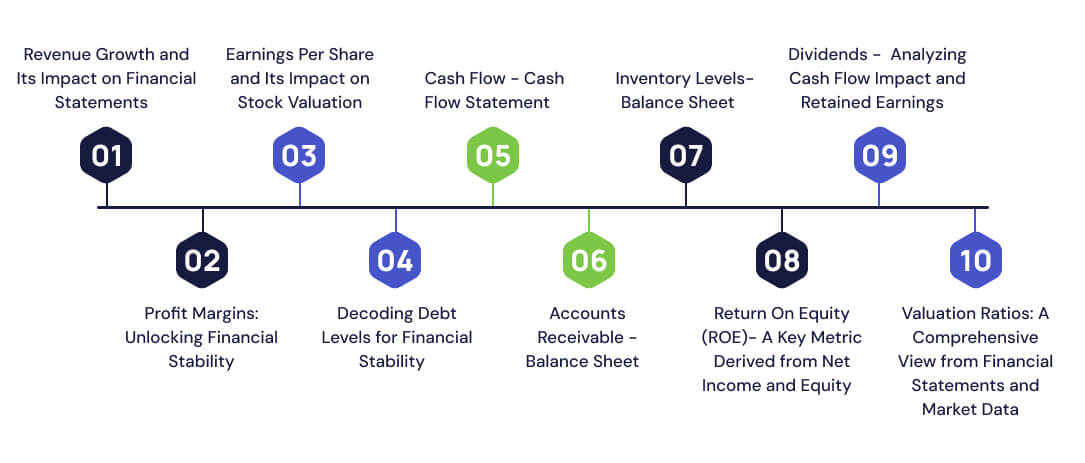
We have listed down ten signs that you, as an investor, must look for in a financial statement.
Revenue Growth and Its Impact on Financial Statements
First thing first, as an investor, you should look at the revenue growth of the firm in question. It will help you understand the company’s ability to increase its sales or not over time. An organization’s growth and capacity to attract new clients are positively indicated if its turnover rate continues to increase steadily.
Let us take an example for better understanding. If a company has over ₹100 crore in sales in one year and ₹120 crore the following year, it means that the organization is registering a 20% growth yearly. However, make sure to be aware of unsustainable growth.
Profit Margins: Unlocking Financial Stability
Two primary categories of margins include:
Gross Profit Margin
It highlights the efficiency of the company producing its products by looking at the differences between the cost of the goods sold (COGS) and the sales.
Net Profit Margin
Net profit margin is the profit after all expenses have been removed from sales.
Having a high or at least an improving profit margin shows that the organization is managing its costs effectively.
Earnings Per Share and Its Impact on Stock Valuation
The amount of profit allocated to each shareholder over a specific period is indicated by EPS. Businesses that have a growing EPS are doing well since it indicates increased profitability and improved returns for shareholders.
Decoding Debt Levels for Financial Stability
Having a comprehensive understanding of a company’s debt structure is necessary. If it has a high Debt-to-equity ratio, then it is pretty alarming, as it suggests that the company might be over-leveraged and can fail to fulfil its responsibilities in the event of a recession.
Cash Flow – Cash Flow Statement
The cash flow statement shows the amount of money generated by a company’s operations and how it is allocated to dividend payments to shareholders, business investments, and expenses. A favourable operating cash flow is a sign of sound financial standing.
Accounts Receivable – Balance Sheet
Accounts receivable are the amounts that the customers owe to the company from credit sales. It is great to see the revenues go up, but having a significant increase in accounts receivable might showcase that the enterprise is selling goods on credit and taking longer than it usually does to collect all the cash for them, which inflates revenue figures and creates risks.
Inventory Levels – Balance Sheet
Having high inventory levels highlights that the company’s products or services are not selling as per the expectation. A low inventory turnover ratio is a sign that there is excessive stock, which leads to possible markdown and less profitability.
Return On Equity (ROE)- A Key Metric Derived from Net Income and Equity
ROE measures the effectiveness of the organization using its shareholder’s equity to make a good profit. Having a high ROE indicates successful utilization of equity capital together with the right amount of management controls.
Dividends – Analyzing Cash Flow Impact and Retained Earnings
The dividend payout ratio, which shows the percentage of earnings distributed as dividends, should be taken into account if a company pays dividends. A sustainable payout ratio, often less than 60%, indicates that the company can continue to pay dividends or increase them without jeopardizing its financial stability.
Valuation Ratios: A Comprehensive View from Financial Statements and Market Data
Investors can determine whether a stock is reasonably priced by using valuation measures. Among the often-used ratios are:
- Price-to-Earnings (P/E) Ratio: Examines the difference between a company’s share price and earnings per share.
- P/B, or price-to-book Ratio, Examines the difference between a company’s share price and book value per share.
Investors can use these statistics to determine whether a stock has been overpriced or undervalued in relation to its assets or earnings.
Tips And Tricks On How To Smart Invest!
Learn some tips on how to invest smartly with us and avoid any mistakes in future.
Be Consistent
Prioritize steady performance throughout a number of periods as opposed to a stellar year.
Industry Comparisons
To determine relative performance, compare financial data with peers in the industry.
Analysis and Discussion of Management (MD&A)
To learn more about management’s perspective on the company’s performance and prospects, read this section of the annual reports.
Never disregard the footnotes in understanding income statements, as they frequently include essential details about accounting rules, possible hazards, and other essential matters.
Red flags and trends
Keep an eye on critical financial indicators for patterns and be alert for warning signs like diminishing margins, rising debt, or odd increases in accounts receivable.
What Are the Best Practices for Efficient Financial Statement Analysis?
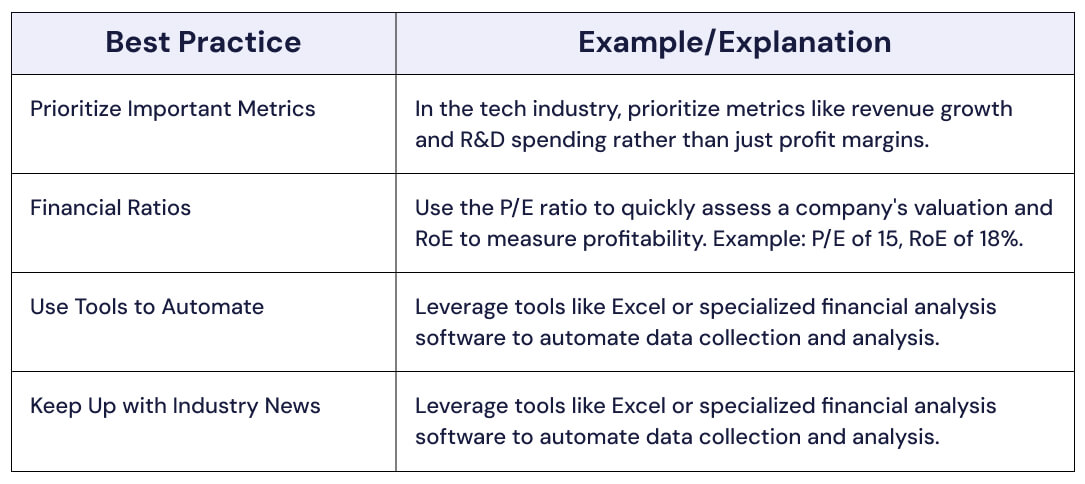
Given below are the best practices that you should keep in mind for practical financial statement analysis
- Prioritize important metrics: Determine which indicators are most crucial for the particular industry.
- Financial Ratios: Use ratios like P/E and RoE to summarize the company’s performance swiftly.
- Use Tools to Automate: Make data collection and analysis more efficient by utilizing financial analysis tools.
- Keep Up: In order to contextualize your study, stay up to current on company updates and industry news.
Here’s an example for better understanding:

Conclusion
If you are looking to make informed investment decisions, then financial statements are a goldmine for you. Focus on key metrics and genuinely understand the idea behind the numbers; with this, you will be able to uncover the core value of a company and avoid any potential risks.
Understand these concepts from top experts only at Expertify Now. Download the app from Google Play or Play Store and start your session with an expert right away. Get the best guidance on financial analysis and become the master of the essentials. With the right guidance, you will be on your way to making smarter and more confident investment choices.
Financial statements provide a detailed overview of a company’s financial health, including its income, expenses, assets, and liabilities. They are crucial for making informed investment decisions.
Focus on key metrics like revenue growth, profit margins, earnings per share (EPS), and return on equity (ROE). Using tools and staying updated on industry trends will help streamline your analysis.
Look for consistent revenue growth, manageable debt levels, strong profit margins, and positive cash flow. Pay attention to red flags like high accounts receivable or excessive inventory levels.
Expertify Now offers expert guidance on financial statement analysis. Download the app to start a session with a financial expert who can help you master the concepts and make smarter investment choices.


